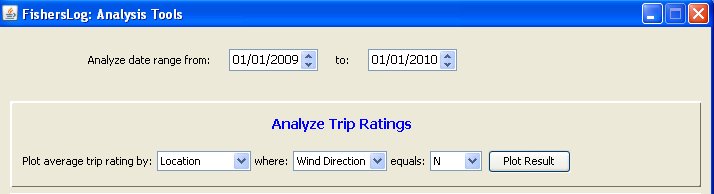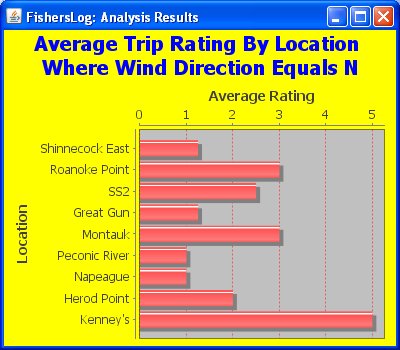
Analysis ToolsThis is where it gets fun. FishersLog provides many ways to visualize your data. Below are just a few examples. Analysis can be run on ratings and catches. Both are important. Suppose you wake up to a North wind. Queries such as the one below can tell you where you've done best in the past on a North wind.
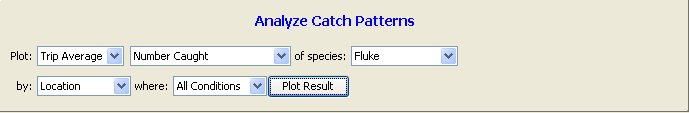
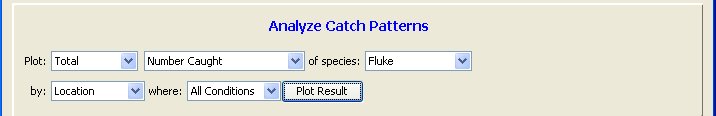
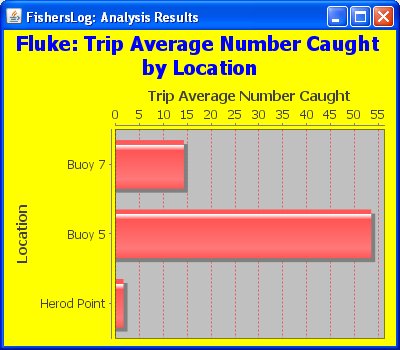
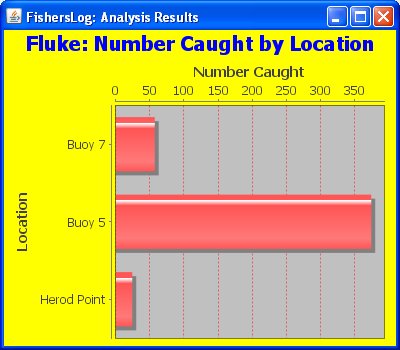
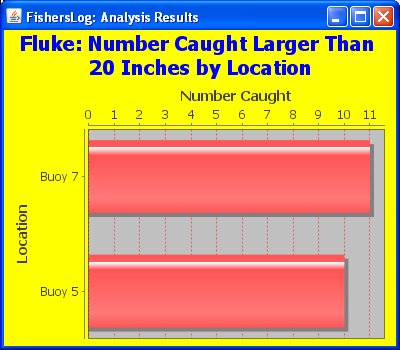
Catch analysis can be eye-opening. Catch totals are always interesting, but catch averages are important too. Consider the queries below on John Skinner's log with respect to fluke (summer flounder) catches during the 2009 season.
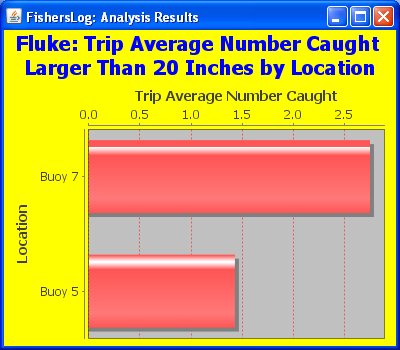
Buoy 5 looks like a winner judging by totals, but fluke needed to be larger than 21 inches to keep in 2009. Which location provides the best chance of going home with fish?
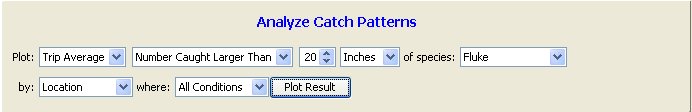
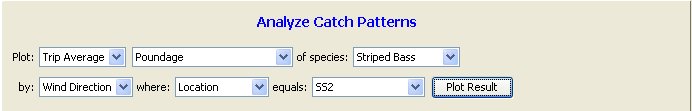
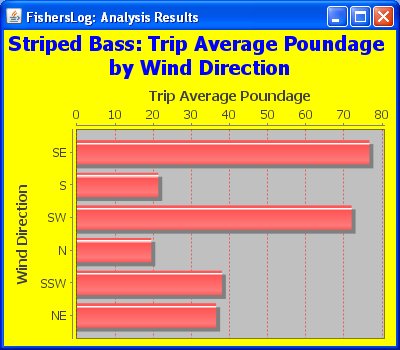
Sometimes it's useful to focus on a location and analyze how it performs under certain conditions.
The bar chart shows that this South-facing shoreline benefits from an onshore wind with a lateral component to push water along the beach. There are many more ways to analyze your data!
|